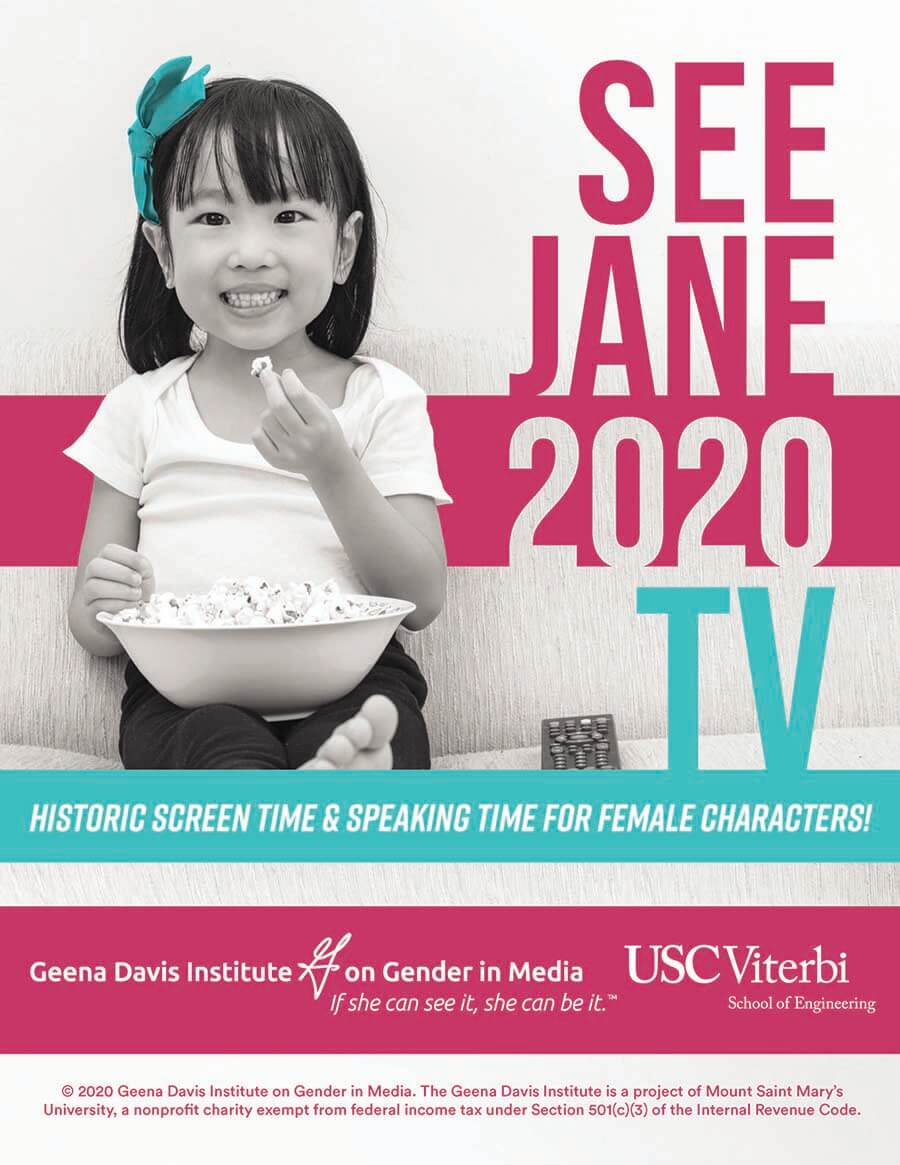
This report examines the representation of diverse groups in children’s television, highlighting disparities in gender, race, LGBTQ+ visibility, and more. Findings from 2020 reveal significant gaps in screen and speaking time, with female characters seeing a mix of progress and setbacks in their portrayal. The study calls for enhanced inclusivity and accurate representations across all forms of diversity to combat stereotypes and foster equality in media consumed by children.
Key Findings
Gender
- Forty-five percent of children’s television episodes have a female lead, a decrease from 52.0% in 2018.
- Female characters account for a majority of screen time (58.7%) and speaking time (58.8%) in live-action kids’ TV shows, which is higher than any previous year we have studied.
- Compared with male characters, female characters are three times more likely to be shown in revealing clothing (6.0% compared with 2.2%) or partially nude (3.3% compared with 1.0%).
- Male characters are more likely than female characters to be shown as violent (16.2% compared with 12.8%) and twice as likely to be depicted as criminal (6.0% compared with 3.2%).
- Male characters are more likely to be shown in professional positions, such as doctors and lawyers (16.8% compared with 12.3%), while female characters are more likely to be shown in service positions (25.8% compared with 21.2%).
- Among characters in STEM professions, male characters outnumber female characters 2:1 (70.2% compared with 29.8%).
- Two-thirds (62.6%) of children’s TV episodes pass the Bechdel-Wallace Test.
Race
- People of color constitute 38% of people in the U.S. but 31.9% of leads in children’s television — an improvement from 26.1% in 2018.
- Characters of color are more likely than white characters to be shown as violent (16.1% compared with 13.8%).
- Characters of color are more likely than white characters to be shown as leaders (38.4% compared with 34.7%).
LGBTQ+
- Less than 1% of all characters in the top children’s TV shows are LGBTQ+.
- Only 3.3% of children’s TV episodes passed the Vito Russo Test, which measures representations of LGBTQ+ characters.
Disability
- People with disabilities are 19% of the U.S. population, but only 0.8% of all characters in the top children’s TV shows are depicted with a physical, communication, or cognitive disability.
- Among characters with disabilities, 7.1% are shown as “The Super Crip” trope.
- Characters without disabilities are more likely than characters with disabilities to be depicted as having a job (90.1% compared with 85.7%) or shown in formal management positions (3.5% compared with 0.0%).
- Characters without disabilities are over three times more likely than characters with disabilities to be shown as smart (24.0% compared with 7.1%).
- Characters with disabilities are four times more likely than characters without disabilities to be depicted as worse than average-looking (46.4% compared with 11.7%).
Age
- People ages 50 and older make up just under 34% of the U.S. population, but only 9.5% of all characters and 1.0% of leading characters in children’s TV shows.
- Characters ages 50 and older are three times more likely than characters under 50 to be shown as worse than average-looking (32.6% compared with 10.7%).
- Characters ages 50 and older are more likely than characters under 50 to be shown as leaders (48.6% compared with 33.7%).
Large Body Type
- People with large body types make up 39.8% of the U.S. population but only 11.3% of all characters and 5.9% of leading characters.
- Characters with large body types are often depicted in stereotypical ways, including as clumsy (12.9%), as a “loser” (7.5%), or as poorly dressed (7.8%).
- Among characters with large body types, 42.3% are shown as looking “worse than average” or “repulsive,” compared with 9.9% of characters with small or medium body types.
- Characters with large body types are nearly twice as likely as characters with small or medium body types to be depicted as stupid (12.5% compared with 6.5%).
- One-third (36.3%) of children’s TV episodes passed the Cooper Test, a test designed by the Institute to measure representations of people with large body types.
Recommendations
- Increase representation of female, BIPOC, disabled, queer, older, and larger-bodied characters in content.
- Diversify characters in STEM and legal occupations. Increase female characters portrayed in STEM professions, as doctors, and as lawyers.
- Avoid stereotypical representation of BIPOC and disabled characters. Avoid portraying BIPOC characters as violent and disabled characters as lacking agency, to avoid harmful stereotypes.

